Hello AP team,
An alert banner appeared in our Project stating that task usage has exceeded 65 % of the allowed limit and that all flows will be disabled once we reach the quota.
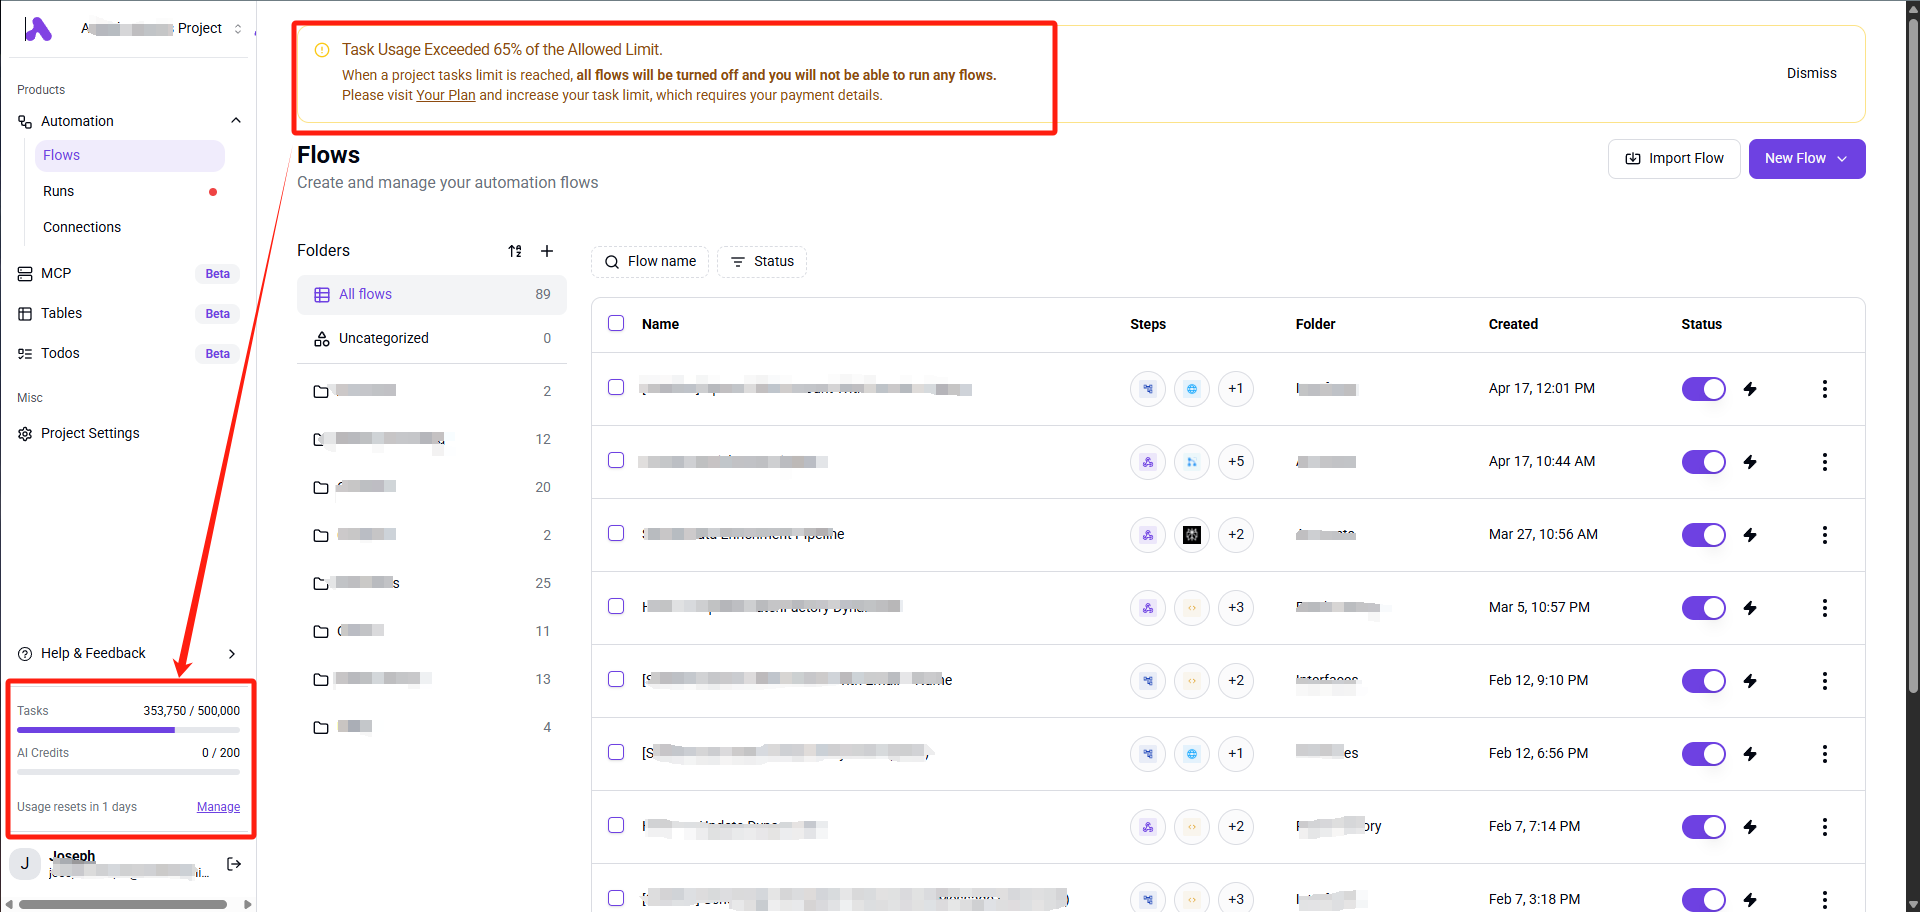
At the same moment, the sidebar meter shows 352,575 / 500,000 tasks for the current cycle (≈ 70 %). The percentages appear to come from two different data sources, and I’d like to confirm whether this is expected or a bug.
What I observe (screenshot attached)
- Yellow banner across the top: “Task Usage Exceeded 65 % of the Allowed Limit.”
- Sidebar usage gauge: 352,575 / 500,000 tasks.
- “Usage resets in 1 day” indicator.
When I click the “Your plan” link in the banner nothing happens. I’m not the primary account holder, maybe that’s the reason why.
Questions
- Which counter drives the banner and how often is it refreshed?
- Does the enforcement engine use a different tally than the sidebar meter?
- Could retries, failed runs, or historical flows be counted toward the banner but not the meter?
Steps already taken
- Logged out and in, hard-refreshed the browser.
Thanks for reviewing this.